


Obstructive sleep apnea (OSA) is a known risk factor for both atrial fibrillation and stroke [1]. Atrial fibrillation (AF) is the most common cardiac arrhythmia in patients with ischemic stroke (IS), with 20% to 30% having known AF [2,3]. It is associated with a 4- to 5-fold increase in incidence of stroke risk [4,5]. Fifteen percent (15%) of all strokes are caused by AF. Atrial fibrillation is associated with longer hospital stays, greater disability, higher recurrence rates, and mortality compared with stroke without AF [6]. The estimated prevalence of sleep-disordered breathing (SDB) in patients with AF has consistently been found to be higher (21-74%) than in control cohorts without AF (3-9%) [7-10].
Approximately 25% of patients with AF have documented OSA. Multiple studies indicate a strong association between ischemic stroke and sleep apnea. Atrial fibrillation was quite constantly reported in the studies of stroke and OSA as an associated factor. Atrial fibrillation was related to higher incidence in stroke and OSA vs stroke without OSA, and it was associated with increased mortality [11]. Obstructive sleep apnea is the most common SDB. It is characterized by collapse of the pharyngeal soft tissues leading to repetitive interruptions of ventilation during sleep [12]. Diagnosis of OSA is usually made when a patient has an apnea–hypopnea index ≥ 5/h and excessive daytime sleepiness. Apnea–hypopnea index (AHI) is the average number of apnea and hypopnea events per hour of sleep (measured with polysomnography) or per hour of recording (measured with respiratory polygraphy). The AHI, scored according to the American Academy of Sleep Medicine (AASM) criteria, is used to classify the severity of sleep apnea with the following empirical cutoff values: <5 events/h (no sleep apnea), 5-14 events/h (mild sleep apnea), 15-29 events/events (moderate sleep apnea), and ≥30 events/h (severe sleep apnea) [8]. It is likely underdiagnosed, and the prevalence depends on stringency of definition used. Estimated prevalence is about 1 in 5 adults having at least mild OSA, and 1 in 15 having moderate to severe OSA. A meta-analysis by Seiler et al. (2019) covered the acute (<1 month, 54 studies both randomized controlled trials and observational), subacute (1–3 months, 23 studies), and chronic (>3 months, 12 studies) post-stroke phases and included 89 studies with a total of 7096 patients with stroke (74% with ischemic stroke) or transient ischemic attack. Sleep apnea (defined as an AHI >5/h) was found in 71% of patients with stroke, which is approximately 4 times more frequent than in the general population [13]. Up to 30% had severe sleep apnea (AHI >30/h), even at 3 months or later after stroke [14]. Other data suggest that as many as 74% of patients with AF may have SDB defined as AHI > 10/h [10].
Obstructive sleep apnea has been associated with hypertension, heart failure, and AF. Other risk factors for OSA include older age and upper airway soft tissue abnormalities. The prevalence of OSA progressively increases as body mass index (BMI) increases. Obstructive sleep apnea prevalence is increasing in developing countries due to an increased prevalence of obesity. The increased prevalence of OSA is linked with increased obesity rates varying from 14% to 55% [15]. The prevalence of OSA has been increasing worldwide over the past two decades. In order to address the risk of OSA and therefore the risk of stroke, the underlying issue of obesity must also be addressed [16]. Untreated severe OSA is associated with increased cardiovascular mortality of any cause. Obstructive sleep apnea has been shown to increase the risk of stroke, independently of other traditional stroke risk factors, such as hypertension, diabetes, and AF. Moreover, OSA is an independent risk factor for stroke, even when controlling for other risk factors such as hypertension, diabetes mellitus, hyperlipidemia, and AF [12,16]. Several studies highlight the occurrence of more severe strokes with delayed post-stroke neurological and functional recovery with attendant disability in patients with OSA. In the context of increasing recognition of OSA as a potentially modifiable risk factor for primary as well as secondary stroke prevention, observations from studies highlight the importance of screening and intervention for OSA not only for prevention of stroke recurrence but also to potentially facilitate post-stroke recovery [17]. Moreover, SDB is associated with cognitive deficits, including reduced attentional and executive functions, decreased learning and memory abilities, and daytime sleepiness. These factors may adversely affect performance during rehabilitation training and, by extension, neural plasticity [18]. Going back to the role of OSA in strokes associated with AF, it is of particular interest how it may be associated with the outcomes of stroke in the presence of AF [19]. Data is lacking to support any differentiated role for OSA.
HYPOTHESIS/AIM
In the acute phase of stroke, OSA negatively impacts outcomes in patients with AF-related cardioembolic stroke. The primary aim of this study is to evaluate the association between OSA at the time of admission, stroke severity, and outcome in AF-related acute stroke patients.
METHODS
This was a case-control study with the prospective inclusion of patients. The recorded demographic variables included age and gender. The recorded clinical and biological characteristics included National Institutes of Health Stroke Scale (NIHSS) score at admission, NIHSS score at discharge, recanalization treatment (endovascular treatment and/or IV thrombolysis), as well as stroke etiology, and risk factors including AF type, coronary artery disease (CAD), dyslipidemia, diabetes mellitus, congestive heart failure, obesity, arterial hypertension, previous stroke or transient ischemic attack, previously witnessed breathing stops in sleep, and history of smoking. NIHSS was performed by the NIHSS-certified neurologist, a member of the stroke team. Functional independence evaluation by modified Rankin scale (mRS) was performed premorbid (pre-stroke), at admission, at discharge, and 3 months after stroke onset. Information on proximal artery occlusion and stroke location were used as radiologic characteristics of stroke. The left ventricle ejection fraction (LVEF) and left atrium (LA) size were recorded as echocardiographic characteristics. The choice of estimating the LA by size (parasternal long-axis transversal diameter on transthoracic echocardiography, TTE) was driven by the technical difficulties and performance variability required to obtain a reliable measurement using the Simpson biplane method, which is generally preferred over LA assessment. The polygraphic characteristics recorded were AHI, apnea types (central, obstructive, etc.), and oxygen desaturation index (ODI). Obstructive sleep apnea was diagnosed using a portable sleep apnea monitor in the acute stroke phase (1-7 days after the onset). The device used the following three main channels: 1) flow – measured by cannula, 2) one-channel thoracic respiratory effort using piezoelectric strain gauge belt, and 3) pulse oximetry (level III device according to AASM standards) (Respironics Stardust® II Portable Diagnostic Device, Philips Respironics, USA) [20]. The devices were used in the intensive care unit or inpatient settings. The nursing staff was trained to follow the appropriate procedures to avoid serious technical problems. The software allowed for manual adjustment of automatically scored respiratory events, which was performed by a trained sleep specialist at a tertiary sleep center. The AASM Manual for the Scoring of Sleep and Associated Events version 2.6 was used for scoring of the recordings [21].
Inclusion criteria were acute ischemic stroke within the first 7 days after the onset, previously documented or newly detected AF (paroxysmal or permanent), and CHA2DS2VASc score ≥2. Exclusion criteria were causes of stroke other than AF (lacunar stroke, atherosclerosis-related stroke, ≥50% of competent artery stenosis, embolic stroke of undetermined source), and Glasgow Coma Scale (GCS) score <13.
Study endpoints
The primary endpoint was NIHSS at admission. Secondary endpoints were NIHSS at discharge, mRS at 3 months, in-hospital mortality, and mortality at 3 months.
Statistical methods
The statistical analysis was performed using SPSS v.22 software. The qualitative data were analyzed using the χ2 test; the quantitative data were compared using the Student’s test, with the accepted significance level below 5%. The qualitative data are presented in absolute numbers with proportions (%), and the quantitative data are presented in mean values with the standard deviation±SD). A multivariate binary logistic regression analysis was performed with functional independence defined as mRS 0-2 and excellent outcome defined as mRS 0-1 at 3 months. All parameters with a significance level of ≤0.2 in the univariate analysis were included in the multivariate model. The 95% confidence intervals for the odds ratio (OR) of each included parameter were calculated by an exponential method using the variance and B coefficient of the multivariate binary regression model. Ordinal regression analysis was performed to evaluate the shift in mRS depending on the AHI group.
Ethical issues
Informed consent was obtained for all patients included in the study. Patients or their relatives were informed about the purpose of research, polygraphy procedure, and the use of the data for research purposes. The study protocol was approved by the local hospital ethical committee (24 Jan 2023, No ErN12-23).
The study was independently funded, without industrial involvement. All financial costs were covered by the hospital.
RESULTS
The study was conducted at the Comprehensive Stroke Center of Erebouni Medical Center in Yerevan, the capital of Armenia, from 01 February 2023 to 31 September 2023. Of the 745 stroke patients screened, 118 were selected for inclusion in the study. All included patients had newly diagnosed acute ischemic stroke and previously documented or newly diagnosed AF. Patients were included prospectively according to the above-mentioned inclusion and exclusion criteria (Figure 1). The study population was characterized by a relatively high age (mean age 73.2±9.34 yeas, median age 74 years, interquartile range [IQR] 66; 81). Global stroke severity was also significant, as the NIHSS at admission was 9.9±6.6. A total of 17 patients were excluded from the analysis due to lack of appropriate polygraphic data, which was explained by technical issues during bedside recording.
Two groups of patients were formed: the first group was patients with AF-related stroke with AHI <15/h and the second group was patients with AHI ≥15/h. Table 1 presents the baseline patient characteristics for the AHI <15/h and AHI ≥15/h groups and the total values. There were no significant differences between the two groups in age, sex, and premorbid mRS score. Cardiovascular risk factors and AF type were also equally distributed between the two groups. The exceptions were obesity (as a qualitative variable using a BMI cutoff of 30 kg/m2) and high BMI (as a continuous variable) in the AHI <15/h group compared with the AHI ≥15/h group, but without reaching statistical significance, p=0.08 and p=0.058 respectively. Stroke radiological parameters, such as anterior vs posterior circulation, occlusion site, and stroke location, did not differ significantly between the two groups. The proportion of patients diagnosed with computed tomography (CT)/CT-angiography vs. magnetic resonance imaging (MRI) was not significantly different between the two groups. The only difference between the two groups at the baseline was that the LA size was significantly larger in the AHI ≥15/h group, 4.50±0.4 vs. 4.17±0.5, p=0.036. There was a tendency towards a decrease in LVEF in the AHI ≥15/h group, 43.6 ±7.0% vs. 39.5±9.3%, without reaching statistical significance, p=0.06.
Primary endpoint analysis
The mean NIHSS score at admission was not statistically different between the AHI <15/h and AHI ≥15/h groups: 10.3±7.4 vs. 10.3±7.4, respectively, p=0.8. This is consistent with equal distribution of occlusion site and large vessel occlusion (LVO) stroke between the two groups (see Table 1).
Secondary endpoint analysis
The mean NIHSS score at discharge did not differ between the two groups: 4.0±4.1 vs. 3.9±4.2, respectively, p=0.9. However, the mean NIHSS score at discharge was significantly lower than the mean NIHSS score at admission: 3.9±4.2 vs. 3.9±6.6, respectively, p<0.0001. The distribution of mRS was not significantly different between the AHI <15/h and AHI ≥15/h groups (Table 2). Functional independence, defined as mRS 0-2 at 3 months, was 66.7% in the AHI <15/h group vs. 73.3% in the AHI ≥15/h group, p=0.6. Excellent outcome, defined as mRS 0-1, was higher in the AHI <15 group (66.7% vs. 55.87%), but without statistical significance, p=0.4. In-hospital mortality and the 3-month mortality also did not differ between the AHI <15/h and AHI ≥15/h groups: 0% vs 0.3%, p=0.13, and 0% vs. 5.8%, p=0.4, respectively.
Polygraphic data showed a significantly higher oxygen desaturation index (ODI) and global desaturation time in patients with an AHI ≥15/h. The day of polygraphic assessment after stroke was almost the same in two groups and was performed on average on Day 4 (Table 3).
The data show that an important proportion of patients with AF-related stroke had very high AHI. The mean AHI was 35.8/h±19.3, with a median value of 33.7 and IQR 22.8; 48.9. A quarter of AF-related stroke patients had a very high AHI, with the 75th percentile at 48.9/h. Therefore, more than 25% of patients had AHI ≥48.9/h (Figs. 2 and 3).
Fig. 3. Range of AHI values in the overall study population. The red line represents the median value.
mRS ordinal shift analysis
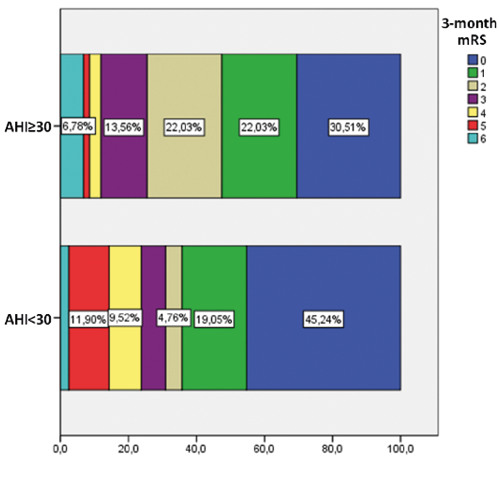
The mRS shift analysis by ordinal regression model is known to have a better sensitivity to detect the mRS change, compared to the mRS 0-2 proportion evaluation. Therefore, an ordinal shift analysis was performed, which revealed no significant differences in mRS shift between the AHI ≥15/h and AHI <15/h groups, as well as between the AHI ≥30/h and AHI <30/h groups (Figs. 4 and 5).
Multivariate analysis
Multivariate binary logistic regression with the dependent variable defined as mRS 0-2 showed a significant inverse effect of the NIHSS score at admission and the protective effect of applied recanalization treatment (endovascular thrombectomy and/or intravenous thrombolysis) on the OR of functional independence in patients. The LVEF and the LA dilatation had a non-significant effect on mRS 0-2 OR (p<0.07). The AHI was not significantly associated with functional independence (Table 4).
Table 4. Multivariate binary logistic regression performed with dependent variable mRS 0-2 at 3 months.
Independent variables | B coefficient | OR | 95% CI | p-value |
Gender | 0.99 | 2.77 | 0.76-9.5 | 0.12 |
AF type | -0.38 | 0.69 | 0.17-2.78 | 0.6 |
AHI, n/h | -0.007 | 0.99 | 0.96-1.02 | 0.6 |
BMI, kg/m2 | 0.08 | 1.08 | 0.96-1.22 | 0.18 |
LA size, cm | 1.59 | 4.21 | 0.88-27.40 | 0.069 |
LVEF, % | 0.07 | 1.07 | 0.99-1.15 | 0.069 |
NIHSS score at admission | -0.29 | 0.75 | 0.65-0.87 | <0.0001 |
Revascularization (EVT and/or IVT) | 2.31 | 11.74 | 1.57-27.70 | 0.02 |
Acronyms: AF – atrial fibrillation; AHI – apnea-hypopnea index; BMI – body mass index; CI – confidence interval; EVT – endovascular thrombectomy; IVT – intravenous thrombolysis; mRS – modified Rankin scale; LA – left atrium; LVEF – left ventricular ejection fraction; NIHSS – National Institutes of Health Stroke Scale; OR – odds ratio. | ||||
In the binary logistic multivariate model, the inversed relationship between AHI and mRS 0-1 proportion remains independent from recanalization treatment and even from the NIHSS score at admission. The multivariate binary model has shown about a 4% excellent outcome (mRS 0-1) decrease for each point of AHI increase (Table 5).
Table 5. Multivariate binary logistic regression with the dependent variable mRS 0-1 at 3 months.
Independent variables | B coefficient | OR | 95% CI | p-value |
Gender | 0.92 | 2.51 | 0.74-8.48 | 8.479 |
AF type | -0.18 | 0.84 | 0.21-0.86 | 0.800 |
AHI, n/h | 0.02 | 1.02 | 0.92-1.15 | 0.668 |
BMI, kg/m2 | -0.04 | 0.96 | 0.93-0.99 | 0.005 |
LA size, cm | 2.01 | 7.50 | 1.45-38.71 | 0.2 |
LVEF, % | 0.12 | 1.13 | 1.04-1.22 | 0.1 |
NIHSS score at admission | -0.29 | 0.75 | 0.65-0.86 | <0.0001 |
Revascularization (EVT and/or IVT) | 2.02 | 6.07 | 1.31-44.50 | 0.03 |
Acronyms: AF – atrial fibrillation; AHI – apnea-hypopnea index; BMI – body mass index; CI – confidence interval; EVT – endovascular thrombectomy; IVT – intravenous thrombolysis; mRS – modified Rankin scale; LA – left atrium; LVEF – left ventricular ejection fraction; NIHSS – National Institutes of Health Stroke Scale; OR – odds ratio. | ||||
As in the good outcome model, excellent outcome was significantly and inversely dependent on the NIHSS score at admission and positively dependent on the recanalization treatment.
Finally, an inverse relation was found between AHI and excellent outcome (mRS 0-1 at 3 months) with statistical significance at p=0.005. In a binary logistic multivariate model, the inverse relationship between AHI and mRS 0-1 proportion remained independent of recanalization treatment and even the NIHSS score at admission. The multivariate binary model showed a decrease in excellent outcome (mRS 0-1) by approximately 4% for each increase in AHI.
DISCUSSION
Our results revealed no relationship between the admission NIHSS score and AHI in the patients with AF-related strokes. This was shown primarily by the absence of a significant difference in the mean NIHSS score between the AHI <15/h and AHI ≥15/ groups: 10.3±7.4 vs.10.3±7.4, respectively, p=0.8. As the predefined primary endpoint, the admission NIHSS score does not differ, the study is negative. Nevertheless, the NIHSS score at admission is dependent on multiple parameters, such as the occlusion site, collateral flow, time since stroke onset, and stroke risk factors; and our study’s insufficient power prevented us from detecting such a relationship.
The mRS is certainly a more integrative endpoint for stroke severity evaluation, but the problem lies in the small number of patients that could be included in the study due to technical and time constraints. We found no relationship between the proportion of functionally independent patients, defined by the mRS 0-2 at 3 months, between the AHI <15/h and AHI ≥15/h groups.
Interestingly, we found a statistically significant relationship between the AHI value and the excellent outcome, defined as mRS 0-1 at 3 months, in a multivariate binary logistic regression model that also included other important variables, such as revascularization treatment and echocardiographic parameters. In this model, the inverse relationship between AHI and the mRS 0-1 remains significant even after including BMI and revascularization treatment parameters. For each AHI point, the OR of excellent outcome decreases by 4%. Echocardiographic parameters such as the LVEF and the LA size remained non-significant, likely due to the small number of patients. Perhaps the inverse relationship between AHI and excellent post-stroke outcome is explained by better neuroplasticity after stroke in patients with a low AHI. There is some experimental and clinical evidence suggesting that sleep plays a crucial role in promoting “plasticity state” in the process of recovery following ischemic stroke [18].
In our study, polygraphy was performed in the first days after stroke in a stroke unit, and consequently the mean delay was 4.13±2.5 days. Our study shows the feasibility of performing polygraphy at the bedside in the acute setting for stroke etiological work-up and acute care. As expected, some technical issues arose: 14.4% (17/118) of patients were excluded from the analysis due to the inability to interpret the recording. These were primarily issues related to patient collaboration, interventions while with the monitor, and significant artifacts involving 2 channels. We also excluded severe stroke patients with consciousness alteration (GCS score <13).
Some authors argue that sleep apnea may have a temporal relationship with the acute phase of stroke, and later it may be improved after the rehabilitation period. Nevertheless, the results of some studies are in favor of AHI remaining stable after stroke, and polygraphic testing in the first days after stroke makes sense for early diagnosis and initiation of continuous positive airway pressure (CPAP) treatment, as well as perhaps for better neuroplasticity. Lisabeth et al. (2023) included 414 patients with stroke via the portable sleep apnea testing at baseline and 3, 6, and 12 months post-stroke. They did not observe time effect on the respiratory event index (p=0.35), and the AHI even increased over time. This study showed that AHI severity was significant and stable for most individuals in the year after stroke, supporting the early assessment and treatment of sleep apnea [22].
Another issue is stroke-related central apnea. In the group of patients with AHI ≥15/h, we found central apnea in 12/86 (14.0%) and mixed apnea in 18/86 patients (20.9%). Early diagnosis of central sleep apnea with a significant index may be important after stroke for choosing an alternative to positive airway pressure (PAP) – adaptive servo-ventilation – when left ventricular function is good enough (LVEF >45%) [23].
Unfortunately, the PAP devices (CPAP or bilevel PAP [BiPAP]) and their application in our country are still subject to some administrative and financial problems, and only a small number of patients included in our study afforded OSA treatment.
Recent research has been focused on finding alternative ways of OSA severity measurement. In this context, AHI is no longer universally accepted as the most representative way of assessing OSA severity. This may be one of the explanations for our partially negative results. Further research is needed to elucidate the associations between the main comparative components of this study: stroke, AF and OSA [24-26].
Our study supports the feasibility and benefits of early detection of sleep apnea after stroke. Despite the small number of patients, our results demonstrate the relatively high prevalence of severe sleep apnea in AF-related stroke when recorded in the first week after stroke. The mean AHI in our study was 35.8/h±19.3, with a median value of 33.7 and IQR 22.8; 48.9. A quarter of AF-related stroke patients had a very high AHI, with 75th percentile at 48.9.
CONCLUSIONS
Our study did not find a statistically significant relationship between the AF-related stroke severity defined by the NIHSS score at admission and the sleep apnea severity.
Univariate analysis of secondary endpoints did not reveal any significant relationship between sleep apnea severity, in-hospital mortality, discharge NIHSS score, and functional independence defined as mRS 0-2 at 3 months.
Nevertheless, using a multivariate binary logistic regression model, we found a significant and independent inverse association between AHI and excellent post-stroke outcome, defined as mRS 0-1 at 3 months. Perhaps this inverse relationship can be in favor of better neuroplasticity in patients with less severe sleep apnea, which is consistent with some published data.
Patients with AF-related stroke represent an important burden of sleep apnea. More than half of our patients had severe apnea with AHI ≥30/h, and more than a quarter of our study population had an AHI ≥48.9/h.
The sleep apnea bedside detection at the very early stage of stroke is quite feasible and demonstrates a very high AHI in AF-related stroke patients, supporting the idea of early introduction of CPAP treatment. The latter should be evaluated in larger prospective studies assessing functional outcomes in stroke patients with early detection and early treatment of sleep apnea after stroke.
The present study could also help with efforts of improving the situation with sleep medicine service accessibility in stroke patients and in general in Armenia.
Fig. 1. Study inclusion flowchart. Schematic design of the study with number of patients on each stage of selection, inclusion and exclusion criteria. Acronyms: AF – atrial fibrillation; AHI – apnea-hypopnea index; GCS – Glasgow Coma Scale; IS – ischemic stroke.
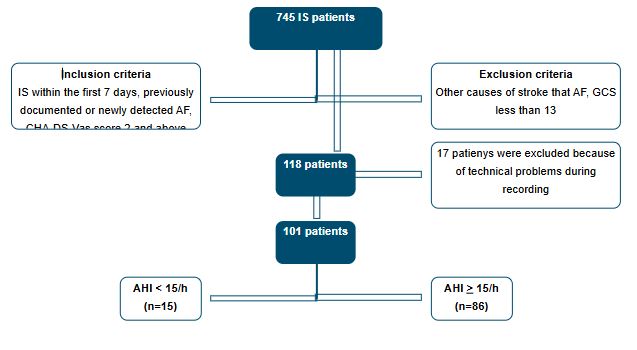
Table 1. Baseline characteristics of patients included in the study.
Patient characteristics | AHI < 15/h (n=15) | AHI ≥ 15/h (n=86) | Total (n=101) | p-value |
Age, years | 68.3±10.8* | 74.0±8.8 | 73.2±9.34 | 0.07 |
Females, n (%) | 11 (73.3%)** | 49 (57.0%) | 60 (59.4%) | 0.2 |
NIHSS score at admission | 10.3±7.4 | 10.3±7.4 | 9.9±6.6 | 0.8 |
mRS score premorbid, n (%) | ||||
mRS 0 | 13 (86.7%) | 78 (90.7%) | 91 (78%) | 0.8 |
mRS 1 | 2 (13.3%) | 6 (7.0%) | 8 (7.9%) | |
mRS 2 | 0 (0.0%) | 1 (1.2%) | 1 (1.0%) | |
mRS 3 | 0 (0.0%) | 1 (1.2%) | 1 (1.0%) | |
mRS 4-6 | 0 (0.0%) | 0 (0.0%) | 0 (0.0%) | |
Cardiovascular risk factors | ||||
Diabetes mellitus, n (%) | 4 (26.7%) | 24 (27.9%) | 28 (27.7 %) | 0.9 |
Obesity: BMI ≥30kg/m2, n (%) | 2 (13.3%) | 31 (36.0%) | 33 (32.7%) | 0.08 |
BMI, kg/m2 | 26.3±3.6 | 28.4±5.0 | 28.1±4.9 | 0.058 |
Smoking, n (%) | 3 (20.0%) | 13 (15.1%) | 16 (15.8%) | 0.6 |
TSH, µU/mL | 2.1±1.7 | 2.8±6.7 | – | 0.4 |
Arterial hypertension, n (%) | 12 (80.0%) | 74 (86.0%) | 86 (85.1%) | 0.5 |
CHF, n (%) | 6 (40.0%) | 46 (53.5%) | 52 (51.5%) | 0.3 |
CAD, n (%) | 5 (33.3%) | 34 (39.5%) | 39(38.6%) | 0.6 |
LDL, mmol/L | 3.3±1.2 | 2.9±1.2 | – | 0.3 |
SDB history, n (%) | 4 (26.7%) | 25 (29.1%) | 29 (28.7%) | 0.8 |
AF type, n (%) | ||||
Paroxysmal | 6 (40.0%) | 19 (22.1%) | 25 (24.8%) | 0.1 |
Permanent | 9 (60.0%) | 67 (77.9%) | 76 (75.2%) | |
Previous stroke history, n (%) | 5 (33.3%) | 26 (30.2%) | 31 (30.7%) | 0.8 |
Wake-up stroke, n (%) | 3 (20.0%) | 14 (16.3%) | 17 (16.8%) | 0.7 |
LVEF, % | 43.6±7.0 | 39.5±9.3 | 40.1±9.1 | 0.06 |
LA size, cm | 4.17±0.5 | 4.50±0.4 | 4.4±0.4 | 0.036 |
OAC previously, n (%) | ||||
Warfarin | 0 (0.0%) | 5 (5.8%) | 5 (5.0%) | 0.3 |
Rivaroxaban | 2 (13.3%) | 20 (23.3%) | 22 (21.7 %) | |
Apixaban | 1 (6.7%) | 1 (1.2%) | 2 (2.0%) | |
No OAC | 12 (80.0%) | 60 (69.8%) | 72 (71.3%) | |
Stroke circulation, n (%) | ||||
Anterior | 12 (80.0%) | 74 (86.0%) | 86 (85.1%) | 0.5 |
Posterior | 3 (20.0%) | 15 (14.9%) | 15 (14.9%) | |
Neuroimaging type, n (%) | ||||
CT | 6 (40.0%) | 45 (52.4%) | 51 (50.5%) | 0.56 |
MRI | 6 (40.0%) | 31 (36.0%) | 37 (36.6%) | |
Both CT and MRI | 3 (20.0%) | 10 (11.6%) | 13 (12.9%) | |
Occlusion Site, n (%) | ||||
No visible occlusion | 4 (26.7%) | 17 (19.8%) | 21 (20.8%) | 0.46 |
Internal carotid artery | 3 (20.0%) | 8 (9.3%) | 11 (10.9%) | |
Middle cerebral artery | 5 (33.3%) | 50 (58.1%) | 55 (54.5%) | |
Anterior cerebral artery | 0 (0.0%) | 2 (2.3%) | 2 (2.0%) | |
Posterior cerebral artery | 2 (13.3%) | 7(8.1%) | 9 (8.9 %) | |
Vertebral artery | 1 (6.7%) | 2 (2.3%) | 3 (3%) | |
Stroke location, n (%) | ||||
Deep | 6 (40.0%) | 14 (16.7%) | 20 (19.8%) | 0.33 |
Cortical | 6 (40.0%) | 47 (56.0%) | 53 (52.5%) | |
Brainstem | 0 (0.0%) | 2 (2.4%) | 2 (2.0%) | |
Cerebellum | 1 (6.7%) | 5 (6.0%) | 6 (5.9%) | |
Deep cortical | 1 (6.7%) | 16 (19.0%) | 17 (17.8%) | |
*Quantitative data are presented in means ± standard deviation. **Qualitative data are presented in numbers with proportions (%). Acronyms: AF – atrial fibrillation; AHI – apnea-hypopnea index; BMI – body mass index; CAD – coronary artery disease; CHF – chronic heart failure; CT – computed tomography; mRS – modified Rankin scale; LA – left atrium; LDL – low-density lipoproteins; LVEF – left ventricular ejection fraction; MRI – magnetic resonance imaging; NIHSS – National Institutes of Health Stroke Scale; OAC – oral anticoagulant; SDB – sleep-disordered breathing; TSH – thyroid-stimulating hormone. | ||||
Table 2. Clinical endpoints of patients included in the study.
Patient characteristics | AHI < 15/h (n=15) | AHI ≥ 15/h (n=86) | Total (n=101) | p-value |
Hospital stay, days | 8.4±6.1* | 9.1±4.9 | 9.22±5.1 | 0.6 |
NIHSS score at discharge | 4.0±4.1 | 3.9±4.2 | 3.9±4.2 | 0.9 |
In-hospital mortality, n (%) | 0 (0.0%)** | 3 (3.5%) | 3 (3.5%) | 0.13 |
mRS score at 3 months, n (%) | ||||
mRS 0 | 9 (60.0%) | 28 (32.6%) | 37 (36.6%) | 0.079 |
mRS 1 | 1(6.7%) | 20 (23.3%) | 21 (20.8%) | |
mRS 2 | 0(0.0%) | 15(17.4%) | 15 (14.9%) | |
mRS 3 | 1(6.7%) | 10(11.6%) | 11(10.9%) | |
mRS 4 | 2(13.3%) | 4(4.7%) | 6 (5.9%) | |
mRS 5 | 2 (13.3%) | 4(4.7%) | 6 (5.9%) | |
mRS 6 | 0 (0.0%) | 5(5.8%) | 5 (5.0%) | |
Functional Independence at 3 months, n (%) | ||||
mRS 0-2 at 3 months | 10 (66.7%) | 63 (73.3%) | 73 (72.3%) | 0.6 |
mRS 3-6 at 3 months | 5 (33.3%) | 23 (26.7%) | 28 (27.7%) | |
Mortality at 3 months, n (%) | 0 (0.0%) | 5 (5.8%) | 5 (5.0%) | 0.4 |
OAC at discharge, n (%) | ||||
Warfarin | 2 (13.3%) | 21(24.4%) | 23 (22.8%) | 0.8 |
Apixaban | 13 (86.7%) | 61 (70.9%) | 74 (73.2%) | |
Rivaroxaban | 0 (0.0%) | 1 (1.2%) | 1 (1.0 %) | |
No OAC | 0 (0.0%) | 3 (3.5%) | 3 (3.0%) | |
Stroke circulation, n (%) | ||||
Anterior | 12 (80.0%) | 74 (86.0%) | 86 (85.1%) | 0.5 |
Posterior | 3 (20.0%) | 15 (14.9%) | 15 (14.9%) | |
Thrombolytic treatment by IV-rtPA, n (%) | 3 (20.0%) | 14 (16.3%) | 17 (16.8%) | 0.7 |
Mechanical thrombectomy, n (%) | 8 (53.3%) | 32 (37.2%) | 40 (39.6%) | 0.24 |
*Quantitative data are presented in means ± standard deviation. **Qualitative data are presented in numbers with proportions (%). Acronyms: AHI – apnea-hypopnea index; IV-rtPA – intravenous recombinant tissue plasminogen activator; NIHSS – National Institutes of Health Stroke Scale; OAC – oral anticoagulant. | ||||
Table 3. Polygraphic characteristics of patients included in the study.
Polygraphic parameters (means) | AHI < 15/h (n=15) | AHI ≥ 15/h (n=86) | Total (n=101) | p-value |
Polygraphy day after stroke | 4.1±3.2* | 4.1±2.3 | 4.13±2.5 | 0.9 |
AHI, n/h | 9.0±4.8 | 40.0±16.9 | 35.8±19.3 | <0.0001 |
ODI, n/h | 6.2±4.3 | 37.8±18.8 | 33.1±20.7 | <0.0001 |
O2 average, % | 94.6±2.9 | 92.4±3.1 | 92.8±3.2 | <0.02 |
O2 desaturation time, min | 28.7±56.8 | 92.0±122.8 | 82.6±117.4 | <0.003 |
Heart rate, bpm | 73.3±13.5 | 67.9±14.6 | 68.75±14.5 | 0.2 |
SA type, n (%) | ||||
OSA | 12 (80.0%)** | 56 (65.1%) | 68 (67.3%) | <0.0001 |
Central SA | 0 (0.0%) | 12 (14.0%) | 12 (11.9%) | |
Mixed SA | 0 (0.0%) | 18 (20.9%) | 18 (17.8%) | |
No significant SA | 3 (20.0%) | 0 (0.0%) | 3 (3.0%) | |
SA severity, n (%) | ||||
AHI <5/h | – | – | 5 (5.0%) | N/A |
AHI ≥5-14.9/h | – | – | 16 (15.8%) | |
AHI 15-29.9/h | – | – | 25 (24.8%) | |
AHI ≥30 /h | – | – | 55 (54.5%) | |
*Quantitative data are presented in means ± standard deviation. **Qualitative data are presented in numbers with proportions (%). Acronyms: AHI – apnea-hypopnea index; bpm – beats per minute; N/A – not applicable; ODI – oxygen desaturation index; OSA – obstructive sleep apnea; SA – sleep apnea. | ||||
Fig. 2. The distribution of apnea-hypopnea index (AHI) in the AHI <15/h and ≥15/h groups.
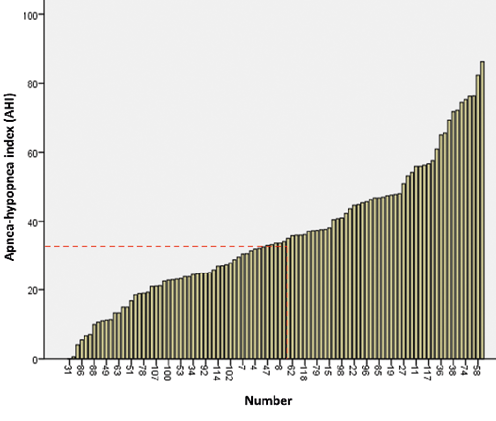
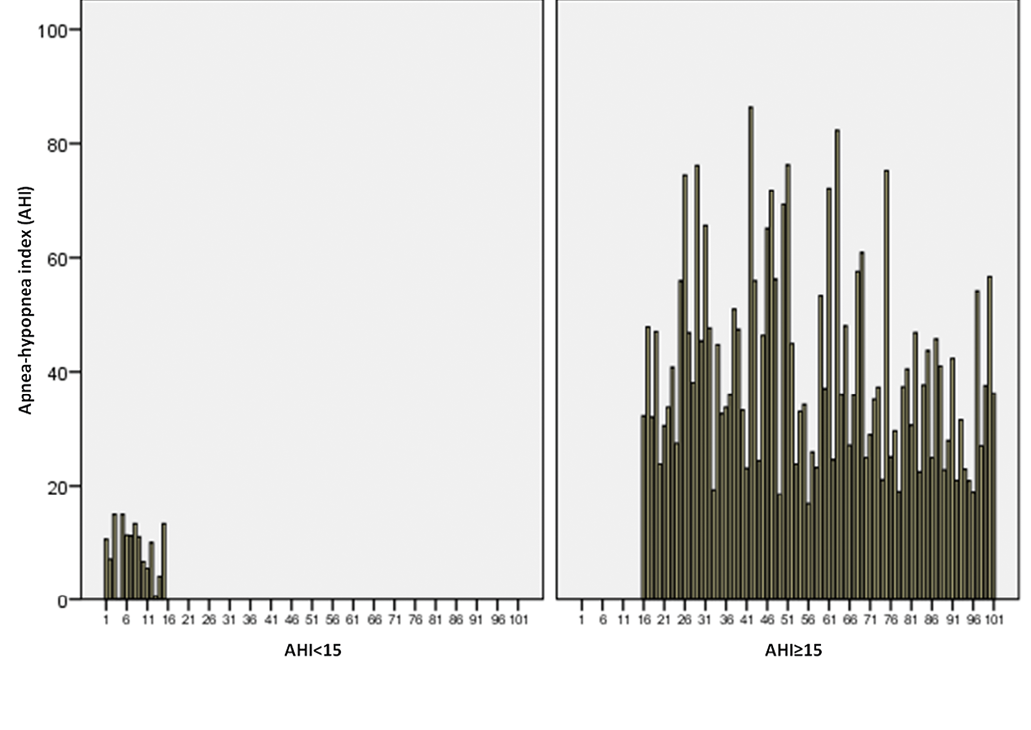
Fig. 4. The 3-month mRS shift analysis (ordinal logistic regression) between the patients with AHI <15/h and AHI ≥15/h showing mRS shift between the two groups. Common odds ratio = 0.52 (95% confidence interval: 0.176-1.6), p=0.25.
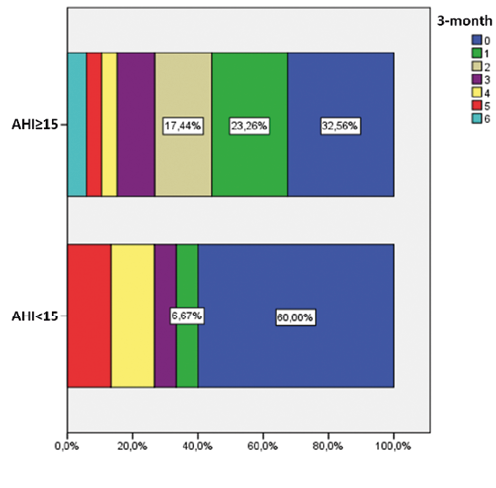
Fig. 5. The 3-month mRS shift analysis (ordinal logistic regression) between the patients with AHI <30/h and AHI ≥30/h showing mRS shift between the two groups. Common odds ratio = 0.74 (95% confidence interval: 0.74-1.5), p=0.41.
References
- Youssef I, Kamran H, Yacoub M, et al. Obstructive sleep apnea as a risk factor for atrial fibrillation: a meta-analysis. J Sleep Disord Ther. 2018;7(1):282.
- Rizos T, Horstmann S, Dittgen F, et al. Preexisting heart disease underlies newly diagnosed atrial fibrillation after acute ischemic stroke. Stroke. 2016;47(2):336-341.
- Traaen GM, Øverland B, Aakerøy L, et al. Prevalence, risk factors, and type of sleep apnea in patients with paroxysmal atrial fibrillation. Int J Cardiol Heart Vasc. 2019;26:100447.
- Yang X, Lippert J, Dekkers M, et al. Impact of comorbid sleep-disordered breathing and atrial fibrillation on the long-term outcome after ischemic stroke. Stroke. 2024;55(3):586-594.
- Wolf PA, Abbott RD, Kannel WB. Atrial fibrillation as an independent risk factor for stroke: the Framingham Study. Stroke. 1991;22(8):983-988.
- Marini C, De Santis F, Sacco S, et al. Contribution of atrial fibrillation to incidence and outcome of ischemic stroke: results from a population-based study. Stroke. 2005;36(6):1115-1119.
- Bitter T, Langer C, Vogt J, et al. Sleep-disordered breathing in patients with atrial fibrillation and normal systolic left ventricular function. Dtsch Arztebl Int. 2009;106(10):164-170.
- Gami AS, Pressman G, Caples SM, et al. Association of atrial fibrillation and obstructive sleep apnea. Circulation. 2004;110(4):364-367.
- Heinzer R, Vat S, Marques-Vidal P, et al. Prevalence of sleep-disordered breathing in the general population: the HypnoLaus study. Lancet Respir Med. 2015;3(4):310-318.
- Kanagala R, Murali NS, Friedman PA, et al. Obstructive sleep apnea and the recurrence of atrial fibrillation. Circulation. 2003;107(20):2589-2594.
- Ramphul K, Lohana P, Verma R, et al. Cardiac arrhythmias and mortality risk among patients with obstructive sleep apnea following admission for acute myocardial infarction or acute ischemic stroke. Arch Med Sci Atheroscler Dis. 2022;7(1):109-115.
- Linz D, Nattel S, Kalman JM, Sanders P. Sleep Apnea and Atrial Fibrillation. Card Electrophysiol Clin. 2021;13(1):87-94.
- Seiler A, Camilo M, Korostovtseva L, et al. Prevalence of sleep-disordered breathing after stroke and TIA: A meta-analysis. Neurology. 2019;92(7):e648-e654.
- Baillieul S, Dekkers M, Brill AK, et al. Sleep apnoea and ischaemic stroke: current knowledge and future directions. Lancet Neurol. 2022;21(1):78-88.
- Sankri-Tarbichi AG. Obstructive sleep apnea-hypopnea syndrome: Etiology and diagnosis. Avicenna J Med. 2012;02(01):3-8.
- Jehan S, Farag M, Zizi F, et al. Obstructive sleep apnea and stroke. Sleep Med Disord. 2018;2(5):120-125.
- Menon D, Sukumaran S, Varma R, Radhakrishnan A. Impact of obstructive sleep apnea on neurological recovery after ischemic stroke: A prospective study. Acta Neurol Scand. 2017;136(5):419-426.
- Duss SB, Seiler A, Schmidt MH, et al. The role of sleep in recovery following ischemic stroke: A review of human and animal data. Neurobiology of Sleep and Circadian Rhythms. 2017;2:94-105.
- Stevenson IH, Teichtahl H, Cunnington D, et al. Prevalence of sleep disordered breathing in paroxysmal and persistent atrial fibrillation patients with normal left ventricular function. Eur Heart J. 2008;29(13):1662-1669.
- Pereira EJ, Driver HS, Stewart SC, Fitzpatrick MF. Comparing a combination of validated questionnaires and level III portable monitor with polysomnography to diagnose and exclude sleep apnea. J Clin Sleep Med. 2013;9(12):1259-1266.
- Berry RB, Brooks R, Gamaldo CE, et al. The AASM Manual for the Scoring of Sleep and Associated Events: Rules, Terminology and Technical Specifications: Version 2.6. Darien, IL: American Academy of Sleep Medicine; 2020.
- Lisabeth LD, Zhang G, Chervin RD, et al. Longitudinal assessment of sleep apnea in the year after stroke in a population-based study. Stroke. 2023;54(9):2356-2365.
- Cowie MR, Woehrle H, Wegscheider K, et al. Adaptive servo-ventilation for central sleep apnea in systolic heart failure. N Engl J Med. 2015;373(12):1095-1105.
- Haba-Rubio J, Vujica J, Franc Y, et al. Effect of CPAP treatment of sleep apnea on clinical prognosis after ischemic stroke: an observational study. J Clin Sleep Med. 2019;15(6):839-847.
- Brown DL, Burns JW, Kwicklis M, et al. Novel metrics of sleep-disordered breathing are associated with outcome after ischemic stroke. Sleep Medicine. 2024;113:116-130.
- Korostovtseva L, Bochkarev M, Amelina V, et al. Sleep-disordered breathing and prognosis after ischemic stroke: it is not apnea-hypopnea index that matters. Diagnostics. 2023;13(13):2246.