

INTRODUCTION
It is well established that elevated salt intake increases blood pressure (BP) and thereby increases the risk of cardiovascular disease (CVD) (hypertension, strokes, heart attacks, heart failure) – the leading cause of death and disability worldwide [19]. The reduction in salt intake significantly reduces the BP and the risk of associated non-communicable diseases (NCD); it is considered the most cost-effective measure to improve health [1,4,7,1015]. The current consumption of salt in most countries (9-12 g/day) is still more than is physiologically necessary [12,15-17]. The World Health Organization (WHO) has recommended salt reduction as one of the top three priority actions to tackle the NCD crisis [18]. At the 66th World Health Assembly, it was unanimously agreed that all countries should reduce their salt intake by 30% towards a target of 5 g/day, by 2025 [19]. The Council of the European Union (EU) has provided its support to the EU framework for national salt initiatives to reduce salt intake [20]; most of the EU member states recommend 2.4 g sodium (6 g salt) daily [21].
Salt reduction strategies are highlighted in numerous comprehensive reviews [1,2,14,15,22-25]. By the end of 2015, a total of 75 countries had salt reduction programmes, that include industry engagement to re-formulate products (n = 61), establishment of sodium content targets for foods (n = 39), consumer education (n = 71), front-of-pack labeling schemes (n = 31), taxation on high-salt foods, etc.
Legislative measures related to salt reduction such as mandatory targets, front-of-pack labeling, food procurement policies and taxation have been implemented in 33 countries; 12 – reported reduction in salt intake, 19 – reduced salt in foods, 6
– improvements in consumer knowledge, attitudes or behaviors relating to salt [24]. The majority of programmes apply target-based approach, prioritizing top contributors to daily salt intake, such as bread, cheese, processed meat products, sauces, etc. [1,21,25-30]. Most successful programmes (in the United Kingdom [UK] and Finland) serve as a guide for other countries [2,15,16,22,24,26].
In 2019, at the midpoint towards achieving the WHO target, the progress of the national salt reduction initiatives was reassessed [31]. A total of 96 national programmes were identified, representing a 28% increase in the number reported in 2015. About 90% of the initiatives were multifaceted in approach, and 60% had a regulatory component. Approaches include interventions in settings (n = 74), food reformulation (n = 68), consumer education (n = 50), front-of-pack labeling (n = 48), and salt taxation (n = 5). There has been an increase in the number of countries implementing each of the approaches. The well-functioning programmes are underpinned by effective surveillance systems that monitor population salt consumption patterns and major sources of salt in diet. Nevertheless, many countries still lack data on key areas of salt consumption, such as national salt intake levels and the amounts of salt in local food products. These data are essential for planning a programme that would target the area of greatest weakness and have the greatest impact in terms of health and investment [8,32].
Like many countries, Armenia has been facing a growing NCD burden [33-35]. Over the past 30 years, the NCD prevalence and related mortality in the country have doubled. In 2020, the mortality due to NCDs comprised 80%, and due to four most prevalent NCDs – 70%, with CVD being the lead cause – 47.3%, followed by cancer – 15%, diabetes – 1.3%, chronic obstructive pulmonary disease – 1.1% [35]: factors that account for the most disease burden in Armenia include dietary risks. The country is confronted with excessive salt intake of its population. NCD STEPS Survey (2016) found a mean salt intake at 9.8 g/day among 18-69 aged people: 11 g/ day in men, 8.4 g/day in women [33]. In a parallel study, sodium content was measured in urine of reproductive age women: UNaC/UCr (Urinary Na concentration / urinary creatinine) ratios approximated an average sodium intake of 5.5 g/24 h, equivalent to a salt intake of 13.9 g/24 h [29].
The NCD/CVD prevention and control in Armenia is a stated priority: several policy documents call for a comprehensive health system response to reduce the burden of these diseases.1 Nevertheless, there is a lack of implementable recommendations, on which such a response should be based [34]. The country does not have maximum population salt intake targets. There is no surveillance system to measure, monitor and evaluate population salt consumption patterns and the major sources of salt in the diet; there is a lack of information on the salt content of the main salt-containing foods, commonly consumed in Armenia. Therefore, we conducted an indicative study to measure, compare and prioritize salt content in various processed foods (PFs), so that policymakers can decide on appropriate priority actions to achieve salt reduction in the country.
MATERIALS AND METHODS
Throughout 2019-2021, a total of 229 samples of 8 groups of salt-containing PFs, such as bread, pasta, cheeses of various types, processed meat products (PMP), intermediates, preserved vegetables/pickles, tomato paste, and butter were collected (included in the study), out of which 194 were delivered to laboratories of the Avdalbekyan National Institute of Health (NIH) and “Standard Dialog” for direct chemical analysis of salt in the products. The remaining 35 samples were tested for salt content by PF industry units, and the results were reported to our study group (we relied on accuracy of data from food manufacturer’s laboratories).
The daily intakes of the above PFs were estimated, and then, once an estimate of salt content for a specific type of product was determined, the average daily intakes of salt from each product or each group of foods were calculated. Four groups of salt-containing PFs – bread products, cheeses, PMPs and pasta – composed > 81% of laboratory samples (186 of 229), due to very large variety of PF types, having specific consumption patterns and saltiness; for these PF groups, weighted averages of salt content were calculated, as well.
- Bread products. The types of bread commonly consumed in Armenia were classified into three groups – premium wheat bread, first grade wheat bread, and lavash, with consumption levels of 5.59,
1.42 and 1.08 kg/month, respectively; hence, the total consumption of bread per capita per month was 8.09 kg [36], and per day – 270 g. A total of 24 bakeries were randomly selected in Yerevan and nearby marzes: the bread producers were interviewed face-to-face or by phone. The questionnaire included questions on the type of bread produced and the amount of salt added to a 25or 50 kg bag of flour when making dough. The salt content in 51 samples of finished products was calculated from the baker’s recipe (BR) dividing salt concentration in the flour to 1.25 [22]. Besides, the salt content in bread was assessed through direct measurement. Bread samples – 7 in total – were collected from 7 supermarkets of Yerevan and transported to the NIH laboratory for analysis. The original samples were popular types of bread – “matnakash” (leavened bread, “naan”) and white or brown loafs. - Cheese products. To categorize and estimate average daily intake of cheese in Armenia, the following basic facts on cheese consumption were considered:
► In Armenia, 95% of total cheese production is cow milk cheese [37,38]; 85% of consumers prefer domestically produced (saltier) cheeses [39]. Ethnic cheese types are Lori, Chanakh, Chechil and Buried cheese; import substitution is promoted through production of Sulguni, Gouda, Edam, Emmental, Feta, Blue cheese, Cheddar, etc. [37-39]; 60 large and medium-size enterprises and small factories operate in the sector; almost all cheesemakers are engaged in production of Lori and Chanakh cheeses [40].
► On average, people in Armenia consume 10 kg of cheese per year [38,41]. In accordance with ARMSTAT data (2012-2020), the mean ± standard deviation (SD) is 9.9 ± 0.35 kg/year with standard error of the mean (SEM): 0.26, 95% CI: 9.64–10.16 and coefficient of variation (CV): 3.54%, indicating very low variability of cheese consumption in the country.
► Consumers prioritize semi-soft cheese Lori (66%) and soft Chanakh (26.4%), both aged in brine; for most consumers, Lori cheese has an optimal combination of fat and salt that together with the affordable price makes this type of cheese the market leader [37-39]; Chanakh – the second most popular cheese – is cheaper across the range of all types of cheeses; it has rather salty taste. Far from ratings of the above two types of cheeses, categorized as I and II groups, the remaining types of domestically produced cheeses constitute third, fourth or lower preferences (altogether 7.6%): these are categorized as III group of cheeses – less affordable though having a reasonably low salt content (Sulguni, Chechil, Mozzarella, Gouda, Cottage cheese, etc.). - Processed meat products (PMP). Various types of sausages (50 samples) are categorized in three groups according to their specific processing technologies that determine the magnitude of salt contents and consumption levels. The first group makes up 80% of the total PMPs: it includes the most widely consumed, relatively inexpensive types of cooked sausages (Bologna type), weenie sausages, wieners, and similar snacks with reasonably low levels of salt content. The products of the II and III groups are relatively salty products (these contain more natural meat and are relatively expensive products). The consumption levels of these PMP – 12.5 g [36,42] are approximated with the following ratings 8:1:1, or – I group – 80%; II group – 10% and III group – 10% of the total 12 g PMPs consumed.
- Pasta. Integrated Living Conditions Survey data [36] indicate rather large consumption of various types of imported and locally produced pasta (macaroni, vermicelli, spaghetti, home-made ethnic noodles – arishta and tatar-boraki) amounting to 0.59 kg per capita per month. These PFs are systemized in three groups using information on their specific type, consumption level and saltiness.
- Intermediates, preserves/pickles, tomato paste, and butter, composed the rest four (single) groups of PFs with consumption levels of 0.21, 0.81, 0.07 and 0.18 kg/month or 7.0, 27.0, 2.3 and 6.0 g/day, accordingly [36]. These are not classified across food categories within the groups and salt content in limited number of samples for each group is expressed as arithmetic mean, only.
Determination of the concentration of chloride (from sodium chloride) in PFs. The sodium chloride in all PF samples was determined through measurement of the concentration of chloride ion, using titrimetric method (with silver nitrate) in accordance with the following national or EAEU standards:
► AST 35-94 – bread and bakery products, including pasta;
► GOST 3627-81 – dairy products, including cheese and butter;
► GOST 9957–2015 – PMP and intermediates;
► GOST 26186-84 – processed fruit and vegetable products, tomato paste, preserved vegetables.
The final result of analysis for each sample was the arithmetic mean of two parallel measurements. After determining the salt content in the PFs, the average daily intake of salt from each product was calculated using the percent product weight as salt multiplied by the estimated average daily intake of the product. Values are reported as arithmetic mean, SD, SEM (using t test) and, then, the confidence intervals (95% CI) and CV.
RESULTS
Data presented in Table 1 show that salt content in the bread products of the three main categories varies within 1.38 and 1.70 g per 100 g of the product. The weighted average for salt content in this group of PFs composed: (1.38×69.1% + 1.52×17.6% + 1.70 ×13.3%) ÷ 100% = 1.447 ± 0.152 (or ≈ 1.45 g/100 g); this integral figure is close to the average value for the bread of premium group, since the share of premium breads in the total consumption of bread products is the largest (almost 70%).
The measurement of salt in bread samples by direct laboratory analysis showed that the content of dietary salt in 100 g of “averaged” bread was 1.33 ± 0.31. This is to a moderate extent less than the estimated value, however, can be considered as a value of the same order, therefore, the results from computational and experimental analyses are approximated as 1.45 + 1.33 = 1.78 ÷ 2 = 1.39 g/1 00 g. Then, based on the indicators of the average daily consumption of bread products in Armenia (270 g/day) and the average concentration of salt in bread (1.39%), the average daily salt intake from bread was calculated: 0.0139 × 270 = 3.75 g of salt, which makes 38.3% of the total average daily consumption of salt (9.8 g/day) by the population of the country.
The Table 2 below presents salt levels in different types of cheeses per 100 g. There is a large variation in salt content between different types of cheeses, as well as within the same type of cheese (CV figures are rather high).
The salt levels in popular brine cheeses (categories I and II) are 2-2.5 times higher than in locally produced foreign types of cheeses. On average, the soft brine cheese of Chanakh type (4.77 ± 1.18 g/100 g) contains the highest amounts of salt. However, the weighted average for salt content in the overall cheese product: (3.82×66% + 4.77×26.4% + 1.85×7.6%) ÷ 100% = 3.92 ± 1.40 g/100 g is close to the mean level of salt of semi-soft brine cheese Lori, because of its rather large share in cheese consumed in the country.
In Armenia, the average daily per capita consumption of cheese is 27.7 g [36]. Given the percent salt content of typically consumed cheese (3.92%), the average daily salt intake from cheese is estimated to be 0.0392×27.7 = 1.086 g, which constitutes 11.1% of the mean salt intake (of 9.8 g/day) in the country. The levels of dietary salt in various types of processed meat products are shown in Table 3. The average salt content of different PMPs varies over a very wide range: less salt is found in the group of cooked (“Bologna” type) products (2.33 g/100 g), more – almost 3 times – in the group of smoked and dried PMPs (6.88 g/100 g).2
The weighted average for salt content in PMP group is calculated by formula (2.33×80% + 3.47×10% + 6.88×10%) ÷ 100% = 2.90 g/100 g.
This “averaged” indicator is close to the average of the PMP of the first group, since its share in the total consumption of PMP is 80%. Using the average daily per capita consumption of PMPs in Armenia (12.5 g) and the value of the average percentage of salt in them (2.9 g/100 g or 2.9%), the average daily salt intake from PMP is estimated: 0.029×12.5 = 0.363 g of salt, which makes up 3.7% of the total average salt intake (9.8 g/day) in the country.
Data on salt content in pasta products, presented in the Table 4, show that traditional types of pasta have highest consumption coefficients (the sum of I and II groups amounts to 98.3%) and lowest saltiness, whereas the home-made noodles are rather salty, as salt is added to them by manufacturers prior to consumer purchase. Yet, the share of the noodles is minor and, therefore, the weighted average for pasta group of PF is rather low: (0.08×89.8% + 0.016×8.5% + 3.3×1.7%) ÷ 100% = 0.13 ± 0.031 g/100 g.
Given the average daily per capita consumption of pasta products (19.7 g/day) and the average percentage of salt in them (0.13 g/100 g or 0.13%), the average daily salt intake from pasta is estimated: 0.0013×19.7 = 0.026 g of salt, which is about 0.26% of the total average salt intake (9.8 g/day) in the country.
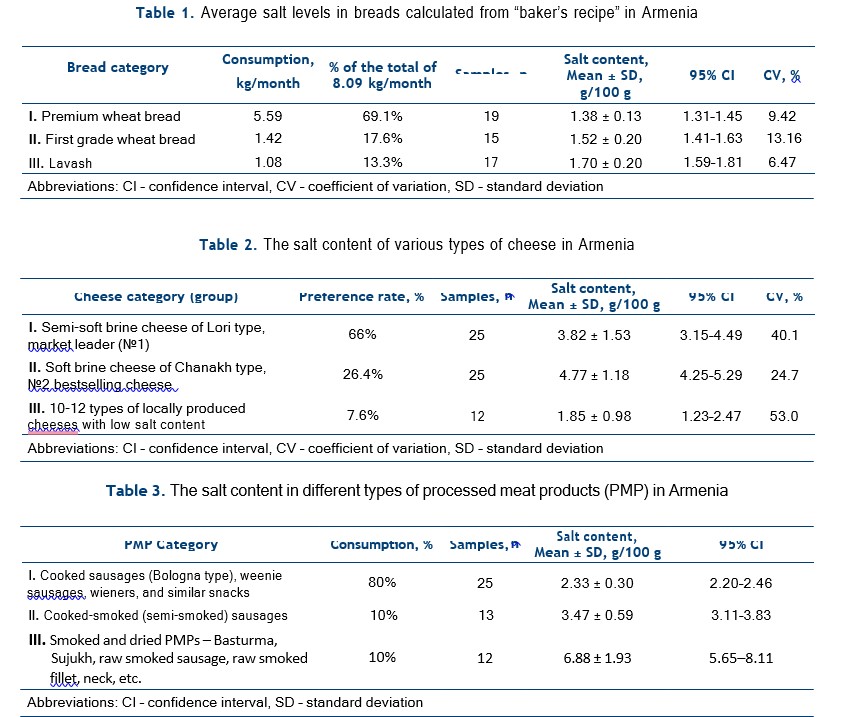
Salt levels in the salt-containing products of the rest four groups of PFs, included in our study, are presented in Table 5. It is shown that significant amounts of salt are determined in various types of pickled/preserved vegetables and semi-finished meat products and somewhat less in tomato paste. The level of salt in the butter is not comparable to salt content in other food products and obviously has much less contribution to daily salt intake. Having data on average daily per capita consumption of intermediates, pickles and preserves, tomato paste, and butter, and the average percent salt content in them, the average daily salt intake from them (using the same formula) is estimated as 1.3%, 6.4%, 0.2% and 0.01% of the total average salt intake (9.8 g/ day) by population in the country.
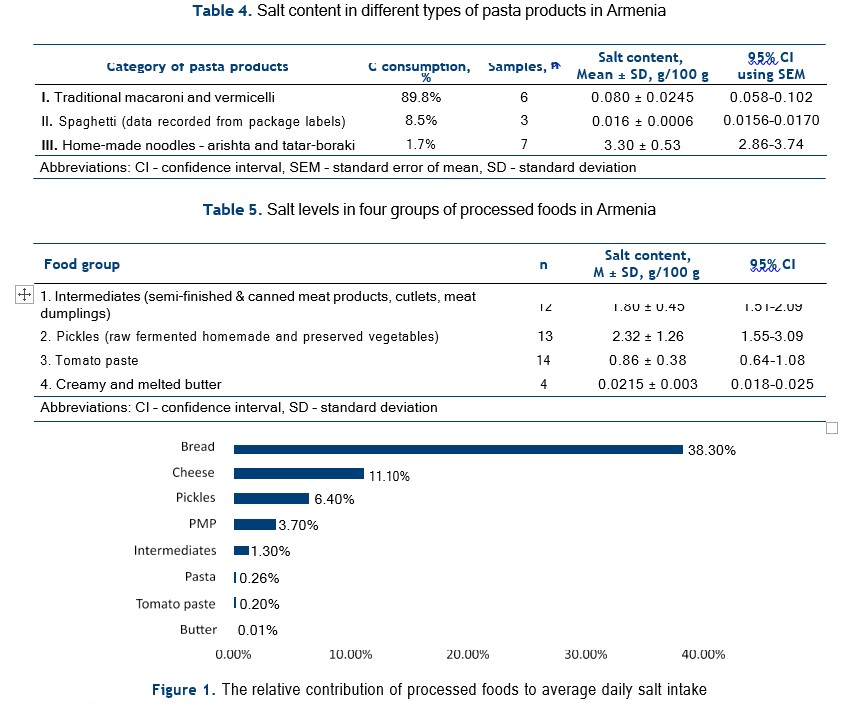
To summarize, the estimated salt contents of identified industrially-processed foods jointly with information on their levels of consumption among Armenia’s population yielded insight into relative contribution of PFs to average daily salt intake: reflected in a descending order: 38.3% (bread), 11.1% (cheese), 6.4% (pickles), 3.7% (PMP), 1.3% (intermediates), 0.26% (pasta), 0.2% (tomato paste), and 0.01% (butter) (Figure 1). The total contribution (the sum) of the selected PFs to the total average salt intake (9.8 g/day) amounts to 61.3%.
DISCUSSION
In Armenia, the list of salt-containing foods is led by bread – the main staple food in the country – leaving far behind other key salt-containing PFs, such as cheese, pickles, and processed and semi-finished meat products.
Bread is classed as a staple food worldwide and has been found to be a major source of dietary sodium [1,21,22,26,28]. In Europe, per capita consumption of bread products (23 countries surveyed) is in average 170 g/day [22]. It is high in Turkey (411 g/day), followed by Bulgaria and Cyprus with 266 and 203 g/day, respectively. Less bread is consumed in the UK, Slovenia, Italy, Austria, Spain, Belgium, Switzerland and France – 101, 107, 121, 126, 126, 129, 132 and 137 g/day, respectively. In the rest 12 countries, this indicator is in the range of 142-192 g/day. The amount of bread consumed daily in Armenia (295 g in 2018 and 270 g in 2020) is more than in most countries of the European Region; it is very close to bread consumption levels (around 300 g) in the countries of the Mediterranean Region [1].
Bread is in the focus of salt reduction strategies, since it provides the highest share (20-25%) of salt compared to other PFs [21,22,24,43]. In the UK [16], the salt content in bread between 2001 and 2011 was reduced by 20% (from 1.23 to 0.98 g/100 g), although, it remains the largest source of salt in the diet, providing 1/5 of the salt intake coming from PFs, only [26]. In Ireland, Belgium, France and Spain, bread accounts for 25.9%, 24.8%, 24.2% and 19.1% shares of the total salt consumed by respective country population [22]. Bread is also the leading salt supplier in countries such as New Zealand (26%) and Australia (20%) [26].
In the Mediterranean Region (8 countries surveyed), the average salt content in bread is 0.76 g/100 g, ranging from 0.43 g/100 g in Jordan to 1.24 g/100 g in Tunisia with relative contribution of bread to average daily salt intake from 1.3 g (12.5%) to 3.7 g (33.5%), respectively [1]. Kuwaitis consume about 12-15 g of salt per day, which is one of the main reasons for the high prevalence of hypertension in the country: the health authorities are taking drastic measures to reduce the salt content in bread – the leading source of salt in the diet of the population (Kuwait’s experience is being adopted by Qatar and Bahrain) [25]. In principle, bread is a key target for population-wide salt reduction as an integral component of public health efforts to prevent CVD, stroke, and other NCDs [1,16,21,22,26,30].
In Armenia, the total average salt intake from bread is rather high (3.75 g, 38.3%) compared to the contribution of bread in salt intakes in many countries in the European and Eastern Mediterranean regions due to both relatively high salt density in bread and high level of consumption of bread in the country. It is obvious that bread should be the key target in the national salt reduction strategy.
Salt content in cheese in Armenia is high, though it varies considerably between different types of cheeses. Salt levels of widely consumed popular brine cheeses are much higher (2-2.5 times), than salt content of locally produced foreign types of cheeses (1.85 g/100 g): the latter are similar to those observed in the UK, the Netherlands and several other countries [27,28,44]. Armenians consume in average some 10 kg of cheese per year, which is twice less than the amount of the product eaten by citizens in EU countries (20 kg) [45]. With its high salt density (3.92 g/100 g), still, cheese tangibly contributes to salt intake of the population: the relative contribution of cheese to average daily salt intake in Armenia (11.1%) exceeds the share that cheese contributes to salt intake in many other countries, such as the UK, the US, Australia, New Zealand and Canada [27]. These countries are known of their long and successful history of implementing salt reduction programmes with reduction targets, set for salt-containing foods, including many types of cheese products.
Large amounts of dietary salt are determined in PMPs (highest in dry fermented sausages/meat snacks) and intermediates. Weighted average for salt content in PMPs (2.90 g/100 g) in Armenia is almost twice higher than the similar indicator in a number of EU countries [46-48]. However, these two PF groups together provide only 5% of salt intakes in the country, whereas, the PMPs themselves are among main sodium contributors to national diets elsewhere: e.g., in Europe (overall) – 16.3% [49], in Spain – 27% [28], in Serbia – 26.9% [50], in Australia – 10% [51]. Relatively low percentage of contribution of PMPs to salt intake in Armenia is attributable to their low level of consumption (12.5 g of PMPs per day compared with 54.7 g/day of the same food group in Serbia [50]). Yet, PMPs and intermediates provide in combination almost half a gram of salt to our diets. Therefore, they can be targeted, helping to lower the levels of the total dietary salt consumed. Alongside with a number of salt-containing PFs (bread, cheese and sauces), the pickles are on the list of major sources of dietary salt [52,53]. In Armenia, with average salt content at 2.32 g/100 g and consumption level of 27 g/day, the pickled foods provide 6.4% of relative contribution of PFs to our average daily salt intake (that is another 626 mg of salt per day). Salt content in pickles does not change much from country to country, as it cannot be reduced considerably when making brined/fermented pickles [54]. The difference between countries in salt intake through pickles is attributable rather to the levels of consumption of the product. Hence, reduction strategy is focused on their limited consumption, substitution with less salty options, public awareness and education, consumer-friendly labeling, etc. [52].
Chlorides are in a certain amount present in the raw material of tomato paste – in tomatoes; however, their higher concentration indicates added salt [55]. In this study, the concentration of salt at 0.86 g/100 g (or 0.86%) slightly exceeds the standard of 0.7% set by GOST 3343-2017 (use of salt in the production of concentrated tomato products is not allowed). But, since the average daily per capita consumption of tomato paste is only 2.3 g, this product does not make a significant contribution (< 0.22%) to the total amount of salt consumed by the population. Obviously, there is no need to offer any special salt reduction measure for tomato paste: it would be enough to follow the requirements of the GOST, aiming avoiding a very small, but still excessive portion of salt, entering the body through this PF.
Pasta products are regularly consumed in large amounts [56]. Except instant noodles, uncooked pasta products make a food group with relatively low salt content (20-80 mg/100 g). Nevertheless, significant amount of salt is taken up by the food during boiling in salted water. The content of sodium in pasta cooked with different levels of salt increases approximately linearly, from 2to 10-fold, depending on the amount of salt added to the cooking water [57]. Apparently, the relative contribution of pasta to salt intake will be far above of the share of 0.26%, estimated in this study (especially from pasta-based ready-to-eat dishes seasoned with pasta sauces). This must be further specified, aiming to yield helpful information for setting guidance for caterers involved in food provision to schools and public sector institutions.
Minor content of salt in the butter (0.0215 g/100 g or 21.5 mg per 100 g of the product) and its low consumption level in Armenia (6 g/day), compared with 27 EU countries (12 g/day) [58], are apparently the main reasons for estimated low contribution of this PF to salt intake in the country (0.01%). The WHO [7] has provided examples of sodium content in various foods/food groups, among which there is a line for butter/margarine with sodium content of 0.5 g/100 g (i.e. 1.25 g of salt per 100 g of the product). It is obvious that further work is needed to specify the content of salt in butters of various types and brands (though its low consumption level will keep the contribution of the butter to the population daily salt intake around 0.3%).
CONCLUSION
More than 60% of salt consumed in Armenia comes from processed foods and is added by food manufacturers prior to consumer purchase. Bread is the basic component of the diet and a key source of the dietary salt, consumed by the population of the country. Interventions to reduce population salt intake should target reduction of salt in bread. The amount of salt added to bread should be standardized and relevant regulations developed to guide bakers. Setting an upper limit for salt content in wheat bread including lavash (Armenian bread) at 1.0% is strongly recommended; salt levels at ≤ 1% would be appropriate for other kinds of bread.
Cheese is the second large contributor of salt to the Armenia’s diet. Cheese and several other salt-containing foods, such as pickles and preserved vegetables, as well as processed meat products combined with semi-finished meat products can be targeted, helping to lower the levels of dietary salt. A reduction in salt intake can be achieved by a gradual and sustained reduction in the amount of salt added to foods by the food industry.
Beyond the largest share of the salt contributed to our diets through processed foods, there is apparently a significant proportion of the dietary salt that comes from the salt added during cooking or from sauces. Regulatory measures can address salt content of the food eaten out of home (salt added while cooking or seasoning prior to consumer purchase). Public health campaign is needed to encourage consumers to use less salt.
REFERENCES
- Al-Jawaldeh A, Al-Khamaiseh M. Assessment of salt concentration in bread commonly consumed in the Eastern Mediterranean Region. East Mediterr Health J. 2018;24(1):18-24
- He FJ, MacGregor GA. A comprehensive review on salt and health and current experience of worldwide salt reduction programmes. J Hum Hypertens. 2008;23:363-384
- Mozaffarian D, Fahimi S, Singh GM et al. Global sodium consumption and death from cardiovascular causes. N Engl J Med. 2014;371:624-34
- Prevention and control of non-communicable diseases in the European Region: a progress report WHO Regional Office for Europe, 2014, 62 p.
- “Salt”. US Centers for Disease Control, Department of Health and Human Services, Atlanta, GA. 1 June 2016
- Prevention of recurrent heart attacks and strokes in low and middle income populations: Evidence-based recommendations for policy makers and health professionals. Geneva, World Health Organization (WHO), 2003
- Guideline: Sodium intake for adults and children. Geneva, WHO, 2012
- SHAKE technical package for salt reduction. Geneva, WHO, 2016
- Hasenegger V, Rust P, König J et al. Main sources, socio-demographic and anthropometric correlates of salt intake in Austria. Nutrients. 2018;10(3):311
- Asaria P, Chisholm D, Mathers C et al. Chronic disease prevention: health effects and financial costs of strategies to reduce salt intake and control tobacco use. Lancet. 2007;370:2044-53
- Bibbins-Domingo K, Chertow GM, Coxson PG et al. Projected effect of dietary salt reductions on future cardiovascular disease. N Engl J Med. 2010;362(7):590-9
- Elliott P. Sodium intakes around the world. Background document prepared for the Forum and Technical Meeting on Reducing Salt Intake in Populations (Paris, 5-7 Oct, 2006). Geneva, WHO, 2007
- He FJ, MacGregor GA. Reducing population salt intake worldwide: from evidence to implementation. Prog Cardiovasc Dis. 2010;52:363-82
- He FJ, MacGregor GA. Salt reduction lowers cardiovascular risk: meta-analysis of outcome trials. Lancet. 2011;378:380-2
- Webster J, Trieu K, Dunford E, Hawkes C. Target Salt 2025: a global overview of national programs to encourage the food industry to reduce salt in foods. Nutrients. 2014;6:3274-87
- He FJ, Brinsden HC, MacGregor GA. Salt reduction in the United Kingdom: a successful experiment in public health. J Hum Hypertens. 2014;28:345-52
- Powles J, Fahimi S, Micha R et al. Global, regional and national sodium intakes in 1990 and 2010: A systematic analysis of 24h urinary sodium excretion and dietary surveys worldwide. BMJ Open. 2013;3:e003733
- Beaglehole R, Bonita R, Horton R et al. Priority actions for the non-communicable disease crisis. Lancet. 2011;377:1438-47
- Sixty-Sixth World Health Assembly. Follow-up to the Political Declaration of the High level Meeting of the General Assembly on the Prevention and Control of Noncommunicable Diseases. Geneva, WHO, 2013
- Council of the European Union. Council conclusions on action to reduce population salt intake for better health. Official Journal of the European Union. 2010:305/3-305/5
- Belz M, Ryan L, Arendt E. The impact of salt reduction in bread: a review. Crit Rev Food Sci Nutr. 2012;52(6):51424
- Quilez J, Salas-Salvado J. Salt in bread in Europe: potential benefits of reduction. Nutr Rev. 2012;70(11):666-78
- Sodium Reduction: An Annotated Bibliography, July 2019, https://www.linkscommunity.org/toolkit/sodiumreduction
- Trieu K, Neal B, Hawkes C et al. Salt reduction initiatives around the world – a systematic review of progress towards the global target. PLoS One. 2015;10(7):e0130247
- Kuwaitis lower blood pressure by reducing salt in bread. Geneva, WHO, 2014
- Brinsden H, He FJ, Jenner KH, MacGregor GA. Surveys of the salt content in UK bread: Progress made and further reductions possible. BMJ Open. 2013;3(6):e002936
- Hashem KM, He FJ, Jenner KH et al. Cross-sectional survey of salt content in cheese: a major contributor to salt intake in the UK. BMJ Open. 2014;4:e005051
- Partearroyo T, Samaniego-Vaesken ML, Ruiz E et al. Sodium intake from foods exceeds recommended limits in the Spanish population: the ANIBES Study. Nutrients. 2019;11(10):2451
- Aslanyan H. Assessment of the actual or potential contribution of industrially-processed food salt to population iodine intake (Final National Report), 2020, National Institute of Health, 2020, 26 p. Available at: http://nih.am/ assets/pdf/atvk/b3f06f006d1098a05156ab9ded11a445.pdf
- Appel LJ, Frohlich ED, Hall JE et al. The importance of population-wide sodium reduction as a means to prevent cardiovascular disease and stroke: a call to action from the American Heart Association. Circulation. 2011;123(10):1138-43
- Santos JA, Tekle D, Rosewarne E et al. A systematic review of salt reduction initiatives around the world: a midterm evaluation of progress towards the 2025 global non-communicable diseases salt reduction target. Adv Nutr. 2021;12(5):1768-1780
- Strategies to monitor and evaluate population sodium consumption and sources of sodium in the diet: report of a joint technical meeting convened by WHO and the Government of Canada. Geneva, WHO, 2011
- NCD STEPS National Survey, Armenia, 2018, (Andreasyan D et al.). National Institute of Health, Ministry of Health, 2018, p. 199 also WHO, 2017. Armenia STEPS Survey, 2016–2017, Fact Sheet
- Better non-communicable disease outcomes: challenges and opportunities for health systems. Armenia Country Assessment (Farrington J et al.), Techn. Report, 2017, 53
p. Available at: http://www.euro.who.int/data/assets/pdf_ file/0018/336123/HSS-NCDs-Armenia.pdf - Andreasyan D, Bazarchyan A, Galstyan N et al. “Health and Health Care” Yearbook, Yerevan: Avdalbekyan National Institute of Health. 2021, 302 p. Available at: https://nih.am/ assets/pdf/atvk/0b0e76b39832ae2244f1522a8581d87c.pdf
- Household’s Integrated Living Conditions Survey anonymised microdata database (purchased and consumed food and non-food products), 2020. Food consumed at home (SPSS) (XLS) (99513313). Available at: https://www. armstat.am/en/?nid=207
- Grant Thornton: Report on the study of milk processing and dairy production sector in Armenia (in Armenian). Rural development foundation in Armenia, 2017
- Study of cheese production and export (in Armenian), Development Foundation of Armenia, WB Group, IFC, Yerevan, 2017, 68 p. Available at: https://www.mineconomy.am/media/5925/1.pdf
- Cheese consumption trends in Yerevan. Center for Agribusiness & Rural Development, 2006, 58 p
- Panorama.am (ECONOMY, 14:47 13/05/2017 ARMENIA). Cheese production increases in Armenia, issues remain a concern. Available at: https://www.panorama.am/ en/news/2017/05/13/Cheese-production-Armenia/1776539
- Statistical Committee of the Republic of Armenia (ARMSTAT: Publications). Food Security and Poverty: Chapter 5 – Accessibility of food, years 2013-2022, Available at: https://armstat.am/en/?nid=82&id=2283; https://armstat.am/en/?nid=82&id=2461
- Statistical Committee of the Republic of Armenia (ARMSTAT: Publications). Output of Main Commodities in the Industrial Organizations (in Kind), January-December 2018-2021 (in Armenian). Available at: https://www.armstat.am/en/?nid=82&id=2112
- Survey on Members States’ Implementation of the EU Salt Reduction Framework, European Commission, Report 2012, 26 p. Available at: https://www.aesan.gob.es/ AECOSAN/docs/documentos/nutricion/observatorio/salt_ report_en.pdf
- Salt content in Gouda cheese again reduced by ten percent. Friesland Campina, 2016. Available at: https://www.frieslandcampina.com/en/news/salt-content-in-goudacheese-again-reduced-by-ten-percent/
- Cheese market in Europe – Statistics and Facts: Publ. by Statista Res. Depart., Feb 24, 2022. Available at: https://www.statista.com/topics/3726/cheese-market-in-europe/#topicHeader wrapper
- FAO ANIMAL PRODUCTION & HEALTH PAPER 52: Small-scale sausage production. SAUSAGE RAW MATERIALS. SALT. Available at: http://www.fao.org/3/ x6556e/X6556E02.htm
- Lilic S, Saicic S, Vranic D et al. Salt and sodium content in dry fermented sausages and dried meat in Serbia. Institute of meat hygiene & technology, Belgrade, Kacanskog 13, Serbia. Available at: https://www.researchgate.net/publication/271523538_Salt_and_sodium_content_in_dry_fermented_sausages_and_dried_meat_in_Serbia
- Sausage Survey – Action on Salt; 06 Dec 2017; Consensus Action on Salt & Health (CASH). Available at: http://www.actiononsalt.org.uk/salt-surveys/2017/sausages-/
- Petit G, Jury V, Lamballerie M et al. Salt intake from processed meat products: benefits, risks and evolving practices. Compr Rev Food Sci Food Saf. 2019;18(5):1453-73
- Jankovic S, Nikolic D, Djinovic-Stojanovic J et al. Sodium intake associated with meat product consumption in Serbia. IOP Conference Series Earth and Environmental Science 333:012065, Oct. 2019. Available at: https://iopscience.iop. org/article/10.1088/1755-1315/333/1/012065
- Sparks E, Farrand C, Santos JA et al. Sodium levels of processed meat in Australia: supermarket survey data from 2010 to 2017. Nutrients. 2018;10(11):1686
- SALT FACTSHEET Sources of dietary salt. Geneva, WHO, 2015. Available at: https://apps.who.int/iris/bitstream/handle/10665/155294/salt-factsheetweb.pdf
- Expert meeting on population sodium reduction strategies for prevention and control of noncommunicable diseases in the South-East Asia Region, 11-13 December 2012. Geneva, WHO, 2013
- Oregon state university: Extension Service. Food Safety and Preservation. Low Salt Pickles SP 50-533, Revised February 2013. Available at: https://extension.oregonstate.edu/sites/default/files/documents/8836/sp50533lowsaltpickles_0.pdf
- Tomato paste: starch, preservatives and salt. Journal of Roscontrol / tests, Jan 29, 2020 (in Russian). Available at: https://roscontrol.com/journal/tests/tomatnaya-pasta-krahmal-konservanti-i-sol/
- Program Guidance on the Use of Iodized Salt in Industrially Processed Foods, IGN, 40 p. Available at: https://www.ign.org/program-guidance-on-the-use-of-iodized-salt-in-industrially-processed-foods.htm
- Change in Sodium Content of Potato, Pasta and Rice with Different Cooking Methods. National Agricultural Library, 2006. Available at: https://www.nal.usda.gov/research-tools/food-safety-research-projects/change-sodium-content-potato-pasta-and-rice-different
- Per capita consumption of butter in the European Union (EU-27) from 2011 to 2021. https://www.statista.com/statistics/415230/butter-per-capita-consumption-europe-eu/